One of the most popular trading signals out there is the Relative Strength Index — or RSI, if you prefer. Many traders believe that when the RSI crosses the default overbought or oversold levels, it signals a great opportunity, as the price is expected to reverse sooner or later.
But what if it’s actually a completely random signal?
Others argue that the RSI is a powerful trend continuation indicator. In fact, I see traders using the RSI in almost every setup, on any timeframe, and across all markets — forex, CFDs, and even cryptocurrencies.
Whenever a question like this comes up, I feel challenged to dig deeper and provide some insights. And when I do, I like to do it my way.
The best way I can think of is by plotting the next 20 bars after each RSI signal. In this case, we’ll do it for the 50 most recent RSI events. This way, we can visually see how the price moved right after — did it pull back, or did it continue?
And of course, we’ll be using MQL5 for this experiment.
Remember, you can play around with the RSI indicator yourself using our Master Oscillators trading bot. You can backtest your ideas for free, and if you want to run it live, there’s also a monthly subscription option.
And of course, don’t forget to take a look at all our trading tools. Let’s dive in!
Let’s start exploring the RSI Indicator signals
RSI[14] crossing above 70 – EURUSD – H1
The very first test we’re going to perform is to see what happens when the default RSI (period 14) crosses above the overbought level of 70.
We could do the same for the oversold level of 30, but the results are almost identical. So we’ll focus on the upper side only.
In this example, we take the last 50 times the RSI crossed above 70 and plot how the price moved (in %) during the next 20 bars. This allows us to visually see how the price behaves right after the signal.
Most traders expect the price to drop within 1–3 bars (hours, since we’re on the H1 timeframe). Others expect it to rise, believing that the RSI is a great trend continuation indicator.
The truth is…
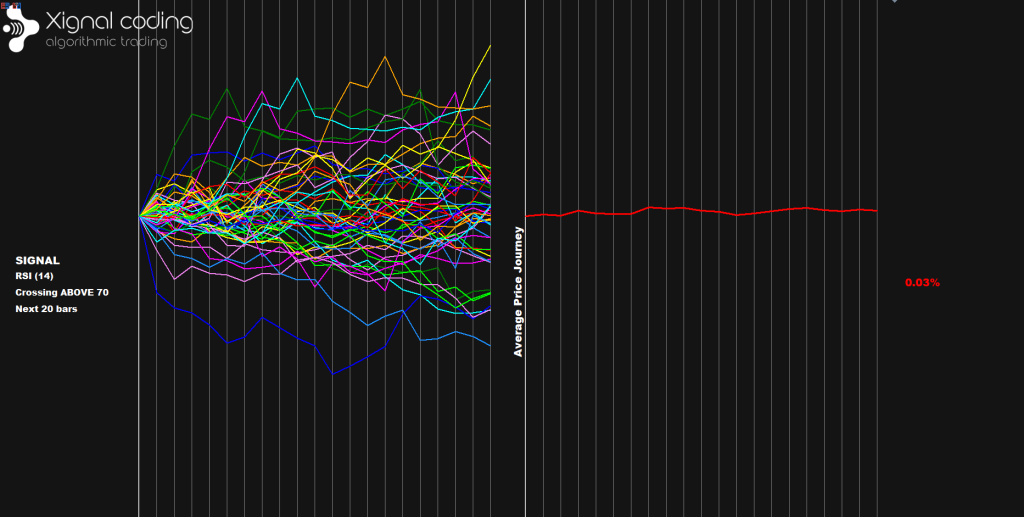
he average movement of the last 50 signals (red line) was almost a flat line. +0.03%
It’s easy to conclude that, in this case, the RSI overbought signal is completely random.
Would the results be different if, instead of FOREX, we tried other categories like CRYPTO?
Let’s find out.
We can run the same test on Ethereum (for some reason, I’ve always liked Ethereum more than Bitcoin).
Obviously, I’ve run multiple tests, but it wouldn’t be meaningful to share all of them in a single post.
However, I might create a short video about it — and if I do, you’ll be able to watch it on my YouTube channel.
RSI[14] crossing above 70 – Ethereum (ETHUSD) – H1
As we can see, things are quite different with Ethereum.
We have a positive average by the end of the 20 bars.
Here’s the graph 👇
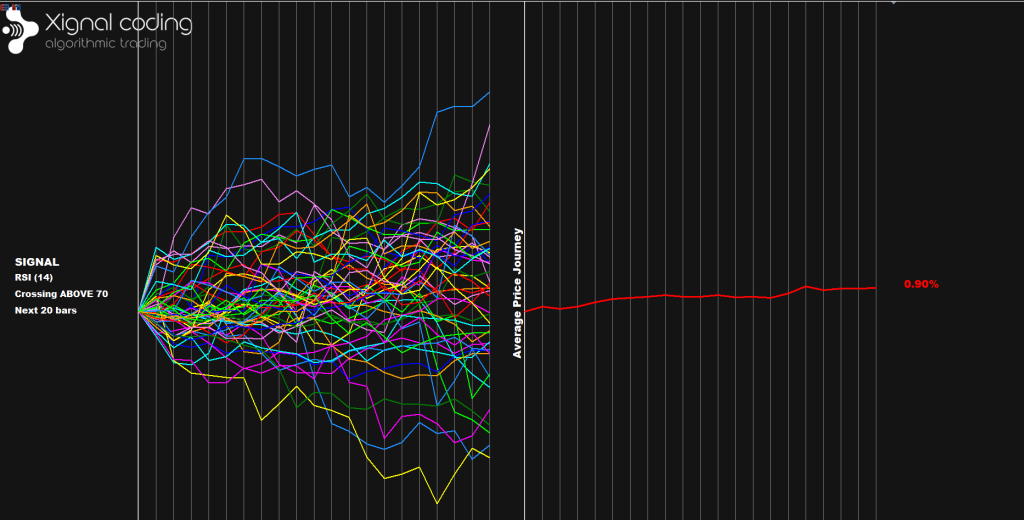
A slight and steady profit of 0.90%.
In this case, we can say that if you were shorting ETH after every overbought signal, you probably wouldn’t have managed to stay positive during the last 50 occurrences.
But wait a minute, we also need to see what happened at the oversold levels.
This could simply be the result of a long uptrend in Ethereum, where the overall bullish bias affected the performance of the overbought signal.
RSI[14] crossing below 30 – Ethereum (ETHUSD) – H1
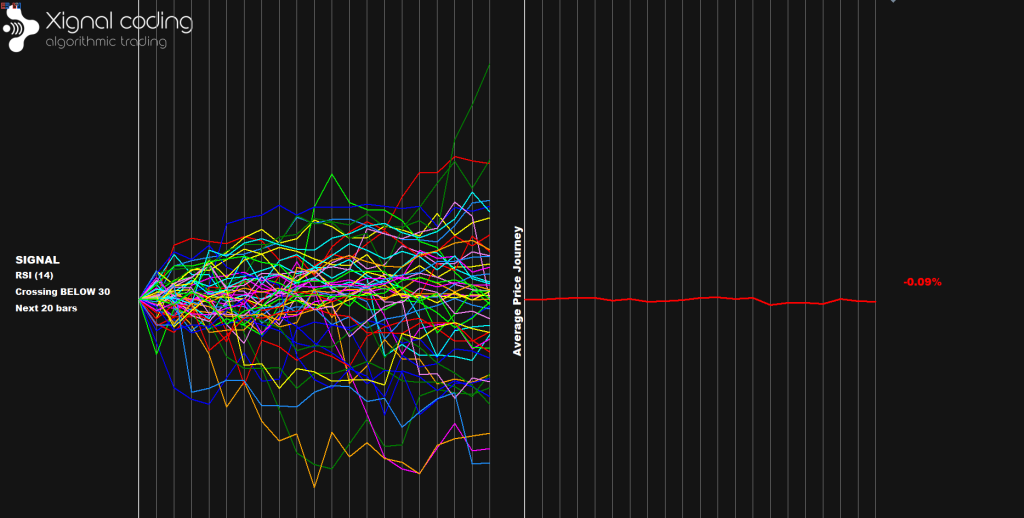
I had to stretch the screen ratio a little bit.
The average change looks like a straight line, but in fact, it’s slightly negative: -0.09%.
Hmm… I would be satisfied if we had a value below -0.5%, but even with this result, we can definitely say that the RSI(14) is not a reliable reversal signal for Ethereum and not even for most other popular cryptos.
Now, whether it can be considered a trend continuation signal, especially for long positions, is up to you to decide.
So far, we’ve explored the Relative Strength Index (RSI) with the default period of 14, and only on the H1 timeframe.
If I were to test every possible combination, I’d probably need more than a dozen posts!
So, we’ll stick with the H1 timeframe for now. But this time, we’ll increase the RSI period to 21 and see how the market reacts after an overbought signal.
RSI[21] crossing above 70 – EURUSD – H1
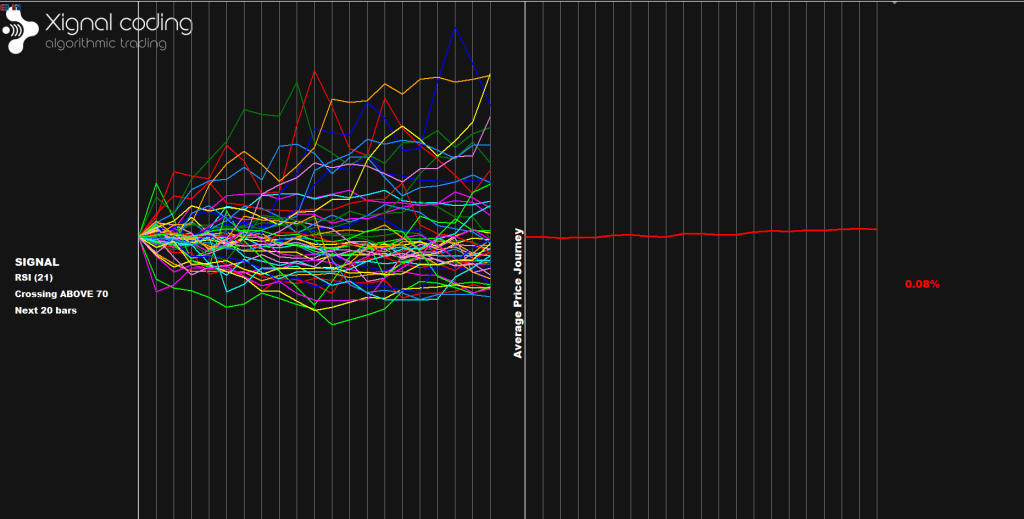
From 0.03%, we went up to 0.08%.
Probably most of us (yes, myself included) expected the average change of the last 50 RSI crosses to be slightly negative.
Many traders believe that the higher the RSI period, the stronger the reversal signal it provides.
But it seems that’s not the case here.
It turns out that the RSI behaves more like a trend continuation signal when used on its own.
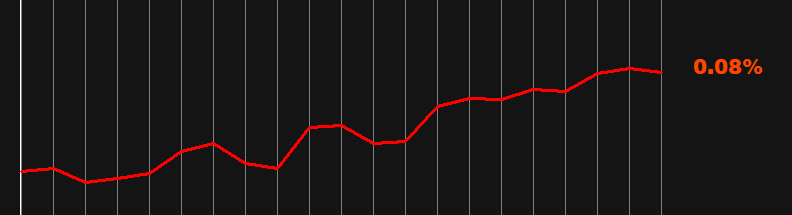
Let me scale the chart properly and zoom in so you can see it better:
Let’s proceed with ETH now.
RSI[21] crossing above 70 – Ethereum (ETHUSD) – H1
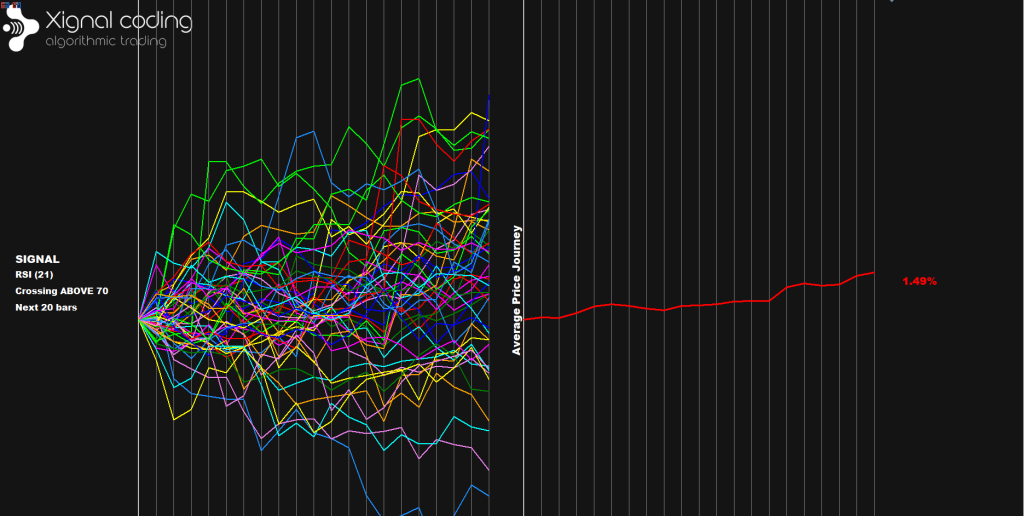
And yes — this is a signal!
Not the one I was expecting, but still, it’s a signal.
The average change over the next 20 bars increased from 0.9% to 1.49%!
Definitely, RSI[21] should not be used as a reversal signal when it’s not combined with other filters or confirmation methods.
Let’s take a quick look at the lower side now, just to be fair to the previous examples.
RSI[21] crossing below 30 – Ethereum (ETHUSD) – H1
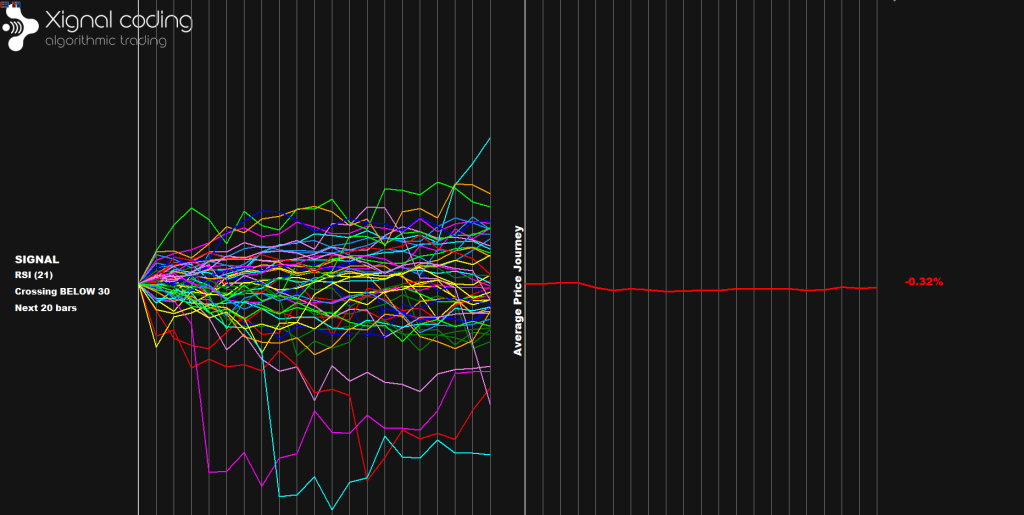
An improvement again — but not in the way we expected.
RSI(21) proves that it can actually be used as a trend continuation signal.
From -0.09%, we dropped to -0.32%!
Before closing this topic, I’m curious to test more instruments.
So, let’s quickly test GOLD here. And more results will come soon on my YouTube channel, where I’ll be testing several instruments and timeframes.
This has really motivated me!
RSI[14] crossing above 70 – GOLD (XAUUSD) – H1
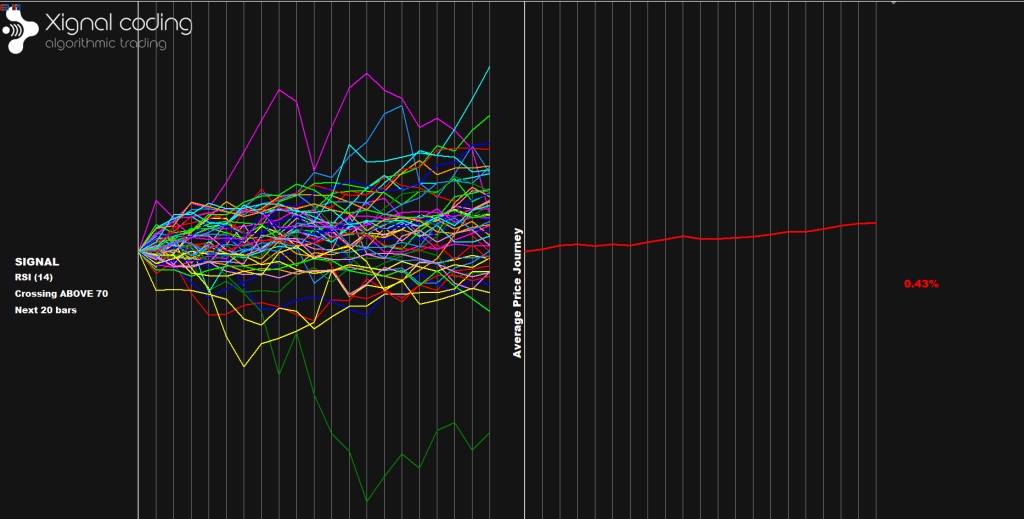
RSI(14) crossing above 70 turns out to be a buy signal for Gold — +0.43%!
Now, let’s see what happens if we increase the period to 21.
Place your bets… 😉
RSI[21] crossing above 70 – GOLD (XAUUSD) – H1
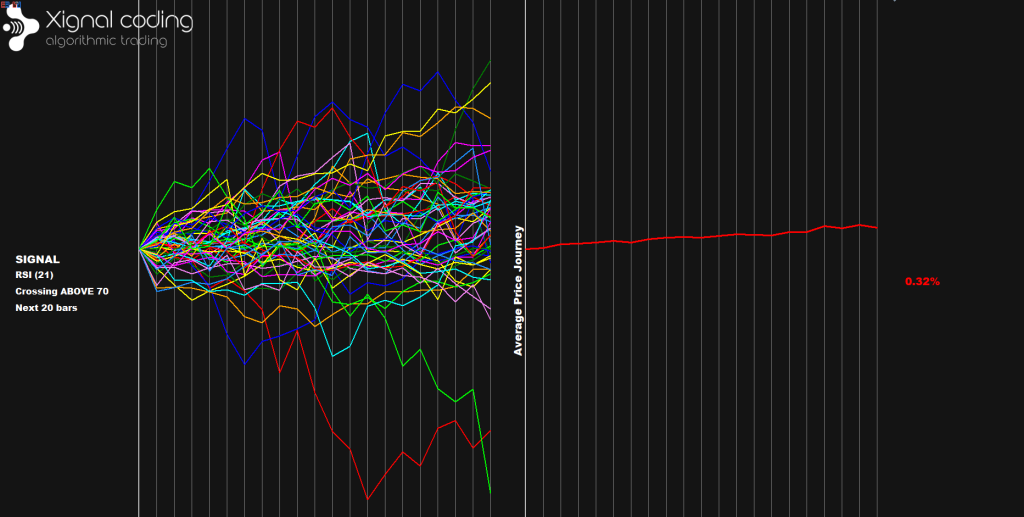
This time the result was slighly lower. From 0.43% we dropped 0.32%, but still positive. Probably we could have a better result if instead of the mean I was calculating the median price. As we can see there were two cases where the price dropped far more than the other 48 cases.
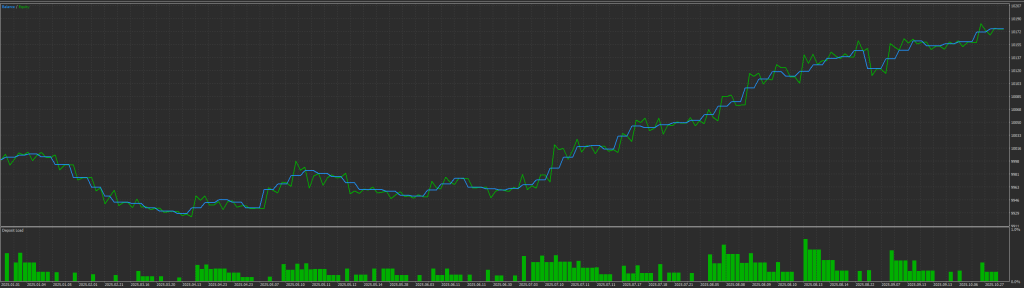
Backtesting the RSI Signal using the Master Oscillators Expert Advisor
Let’s run a quick backtest of our best performer — ETH, using the Master Oscillators Expert Advisor.
The setup is very simple:
- Direction: Buys only
- Exit: Close after 20 H1 bars
- No SL or TP
- Entry condition: RSI(21) crossing above 70
- Testing period: 2025.01.01 – 2025.11.06
- Lot size: 0.10
And the result?
The graph looks amazing!
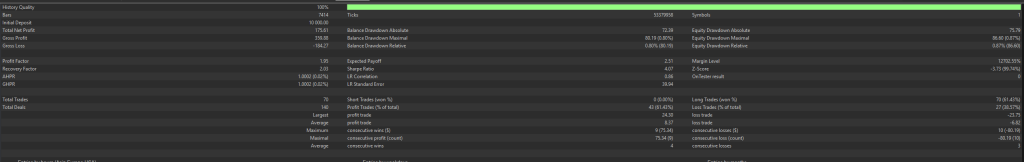
We had a total of 70 trades, about 20 more than we initially calculated.
Sharpe Ratio: 4.07 | Profit Factor: 1.95 | Expected Payoff: 2.55
Do we have a signal?
That’s up to you to decide!
I don’t know if we’ve proven that the RSI is a completely random signal or not,
but I’m pretty sure I’ve made you a little more skeptical about when and how to use it.
More experiments and examples are coming soon — it’s something I truly enjoy doing.
Stay tuned, and let’s keep exploring the markets together!
Ioannis Xenos